
NAEP Scores Suggest Some Concerns for Catholic Schools
Summary
While Catholic school scores continue to dominate public school scores on the National Assessment for Educational Progress (NAEP), it is the internal trends of these scores that tell an interesting story. Grade 8 Catholic school math scores have seen a decline since 2009 after an almost decade trend of gains. Fourth grade math scores showed a steady decline in the differential between public and Catholic school scores from 2000 to 2013 with a rebound, finally, in 2015. NAEP is “the largest nationally representative and continuing assessment of what America’s students know and can do in various subject areas”. It serves as a common metric for states and stays essentially the same from year to year.
Introduction
On October 30, the National Catholic Educational Association (NCEA) published an article stating in its lead paragraph that “Catholic school scores continue to trend higher than public school scores overall by up to 20 percentage points.” Highlighting the fact that Catholic schools “marry rigorous academics, faith formation and Catholic identity,” the article details the major comparisons between 4th and 8th grade math and reading scores on the National Assessment of Educational Progress (NAEP).
That’s great news. But while Catholic schools might still be outpacing the public schools in overall average NAEP scores, fluctuations and the continued decline in 8th grade math scores since 2009 warrant further study, especially in terms of the effects of the Common Core standards in many Catholic schools and instructional shifts required to implement the standards.
Scores for public school 8th grade students in both reading and mathematics showed a decrease this year, but so did Catholic school NAEP scores. In both 8th grade math and reading, Catholic student scores dipped by 2 points. On the other hand, 4th grade reading scores increased by 2 points and 4th grade math by one point.
8th Grade Math and Reading Scores Decline
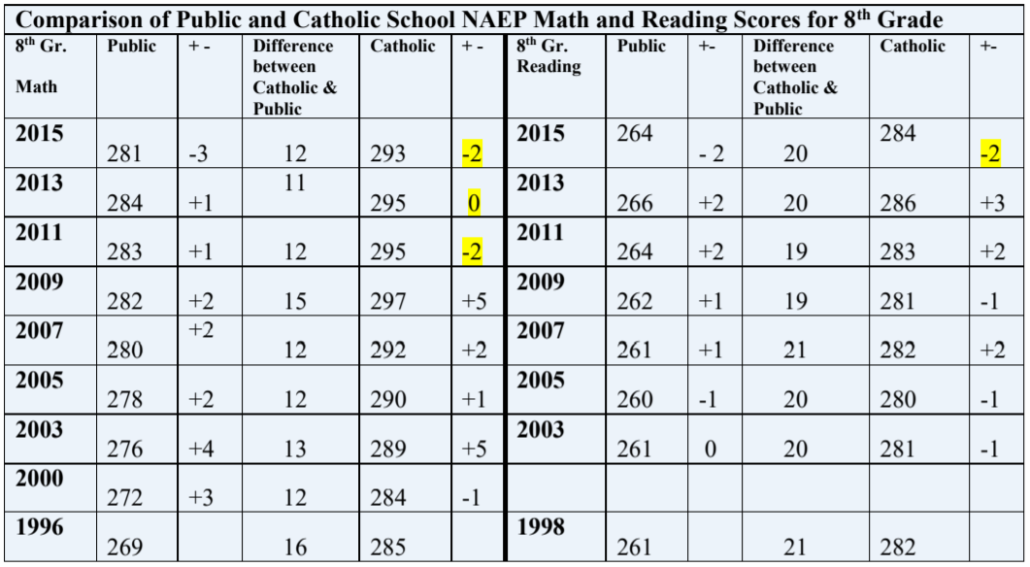
Looking closely at the average math scores for 8th grade Catholic school students (see Table 1) reveals a decrease in the average score for Catholic students since 2009. Catholic schools had enjoyed a run of an average 2 additional points per year, but in 2011 we saw a slide of 2 points that held steady in 2013 then declined again in 2015. With the NAEP acting as the steady barometer of U.S. student abilities, not having been significantly changed since the early 1990s, we need to ask what’s happening in Catholic schools to cause the lower test scores.
Catholic school NAEP scores for 8th grade mathematics have outdistanced public school scores by an average 12-point spread since 1996, but when one examines the Catholic scores closely, the average increase per test drops from 2.4 (1996–2009) to -1.3 (2011–2015). Calculating the trend for the full administration of the tests,1 Catholic schools saw a 1.11 per-test increase from 1996–2015. Yet we have a 2-point drop in 2015.
The 2015 reading score for 8th grade Catholic school students has also declined. While it still represents a 20-point advantage above public school scores, this internal decline is worth noting, because it is out of the expected trend for 2015. The average point increase from 1998 to 2013 was .06 points, so one would not expect a 2-point reduction.
Table 1: 2015 NAEP (2013) – 8th Grade
Sources:
http://nces.ed.gov/nationsreportcard/naepdata/report.aspx?app=NDE&p=2-MAT-2-20153%2c20133%2c20113%2c20093%2c20073%2c20053%2c20033%2c20003%2c20002%2c19963%2c19962%2c19922%2c19902-MRPCM-SCHTYPE-NT-MN_MN-Y_J-0-0-5
http://nces.ed.gov/nationsreportcard/naepdata/report.aspx?app=NDE&p=2-RED-2-20153%2c20133%2c20113%2c20093%2c20073%2c20053%2c20033%2c20023%2c20003%2c20002%2c19983%2c19982%2c19942%2c19922-RRPCM-SCHTYPE-NT-MN_MN-Y_J-0-0-5
4th Grade Math and Reading Score Trends
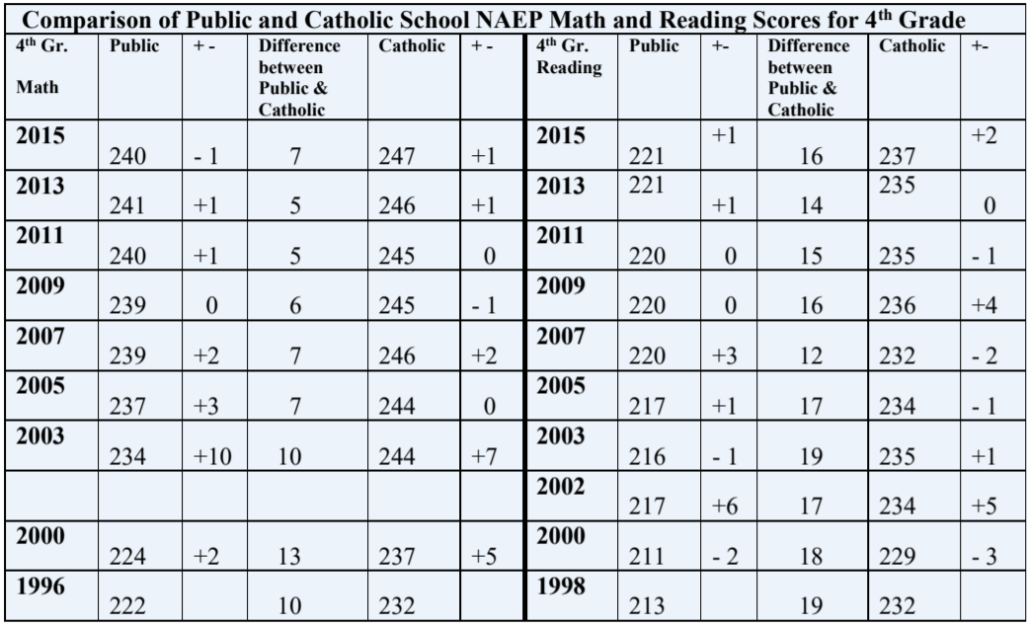
The difference in scores between 4th grade Catholic school and public school students (Table 2) remains substantial in reading, with Catholic scores averaging 16 points higher than scores for public school students. The Catholic reading score increased a promising 2 points after some stagnation since 2009.
What is interesting is this year’s reversal of a trend showing a steady decline in the difference between Catholic and public school student 4th grade math scores since 2000. In 2015 the differential increased 2 points, after decreasing in every assessment from 2003 to 2013. The Catholic school average score increased one point this year.
Table 2: 2015 NAEP (2013) – 4th Grade
Sources:
http://nces.ed.gov/nationsreportcard/naepdata/report.aspx?app=NDE&p=1-MAT-2-20153%2c20133%2c20113%2c20093%2c20073%2c20053%2c20033%2c20003%2c20002%2c19963%2c19962%2c19922%2c19902-MRPCM-SCHTYPE-NT-MN_MN-Y_J-0-0-5
http://nces.ed.gov/nationsreportcard/naepdata/report.aspx?app=NDE&p=1-RED-2-20153%2c20133%2c20113%2c20093%2c20073%2c20053%2c20033%2c20023%2c20003%2c20002%2c19983%2c19982%2c19942%2c19922-RRPCM-SCHTYPE-NT-MN_MN-Y_J-0-0-5
Changes to 8th Grade Math
One factor to consider with regard to math scores is the traditional pace in Catholic schools to move students toward Algebra I in 8th grade. Catholic school data is not available when drilling down to compare scores of students who took Algebra I versus a basic math course in 8th grade, but it is possible to review the trends of public versus private schools as a whole, of which Catholic schools are a part.
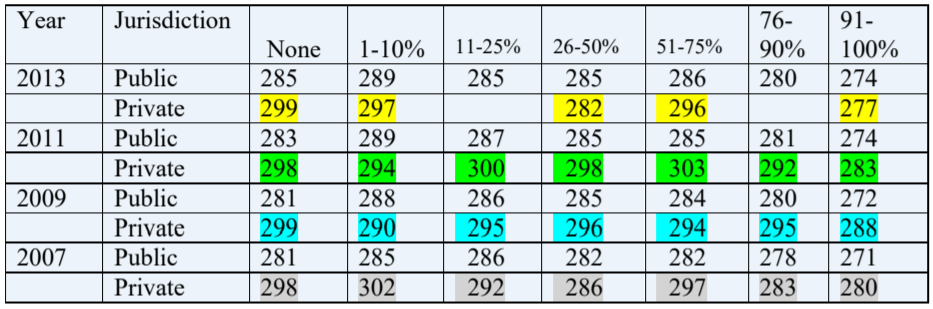
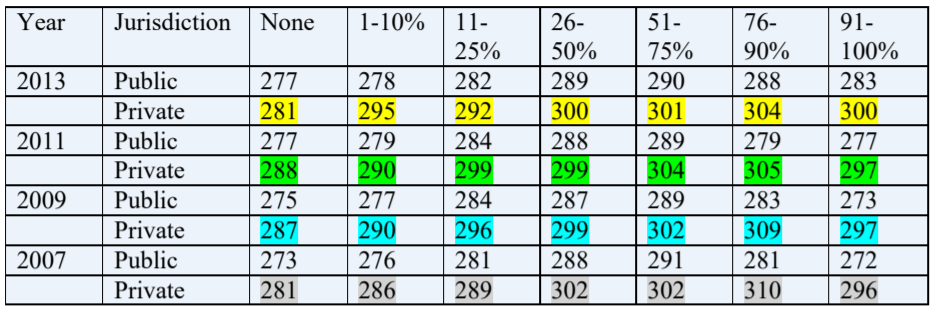
With data available for 2007 to 2013,2 one can see that private school scores outdistance public schools in both 8th grade math and Algebra I (Tables 3 and 4). It is also evident that students who took Algebra I as 8th graders scored better on the NAEP than students who took 8th grade math, especially since NAEP Algebra questions comprise almost a third (29 percent) of the math test.3 With some progressions toward delaying Algebra 1 until high school, Catholic schools would be wise not to follow this delayed progression, should these NAEP scores and entrance to STEM colleges be a concern.
Table 3: Average Scale Scores for mathematics,
Grade 8 by percent enrolled in 8th-grade mathematics
Source: http://nces.ed.gov/nationsreportcard/naepdata/report.aspx
Note: Private school data was not reported for 2015 and no separate Catholic school data is available.
Table 4: Average Scale Scores for mathematics,
Grade 8 by percent enrolled in Algebra I (1 year course)
Source: http://nces.ed.gov/nationsreportcard/naepdata/report.aspx
Note: Private school data was not reported for 2015, and no separate Catholic school data is available.
Effects of Common Core
Has anything changed in Catholic schools to bring about these trends? Certainly, the implementation of Common Core math and English language standards by more than 100 dioceses is the largest single change, but instructional shifts intended to implement the standards should also be reviewed along with other possible factors.
Some Catholic school systems may be using these instructional shifts — such as cognitively guided math instruction, close reading, and the shift between information and fictional texts as recommended by the publisher — and not the standards themselves.
Catholic school systems that participated in NAEP testing (not all Catholic school systems participate) might review the changes they have made since 2009 in both math and reading to begin to pinpoint areas for further inquiry. By doing this review, a great service would be provided to the other diocesan systems.
States such as Maryland and cities like New York are themselves taking on this internal review task since, according to the data, “Not a single state had an increase in 8th grade math scores,” and, “Twenty-two states had declines in 8th grade math.”4
Some have suggested that the drop in NAEP math scores has to do with the misalignment of the NAEP with the Common Core Standards, but a recently released report (Oct. 2015) commissioned by the NAEP Validity Studies Panel, Study of the Alignment of the 2015 NAEP Mathematics items at Grades 4 and 8 to the Common Core State Standards (CCSS), touts that the NAEP mathematics framework was developed to account for all the major curricula across the country (p. iii) and that the alignment in 8th grade math is “strong” and 4th grade is “reasonable.” Nevertheless, the report also suggests that perhaps now is the time for a major review of the framework in light of the Common Core Standards.
Standards and Testing
Catholic school educators cannot rest on their laurels and assume they will always outscore public schools, especially if they slavishly follow public school patterns and standards. Parents in Catholic schools expect outstanding scores. This is not unreasonable, since students who come from supportive, involved, and tuition-paying families are expected to score higher on standardized tests. The academic setting lends to higher scores and demands higher standards.
Catholic schools should ensure that their standards have been created and specifically tailored to not only demand excellence, but also to promote deep, creative, and precise thinking as well as developing within students a sense of wonder about mathematical relationships and critical, convergent thinking in literature. A re-evaluation, especially of the 8th grade math curriculum, along with the instructional approaches advocated by publishers and others, is recommended and long overdue.
Standardized tests should also be chosen to align with the instructional approaches and content standards used in Catholic schools. Working with private assessment companies is extremely important now to ensure a valid assessment of student learning, as well as longitudinal data to evaluate student academic growth and compare against NAEP results.
- Administrations using accommodations for students with learning differences.
- Private school data is not available for 2015 or before 2007.
- Daro, P., Hughes, G., & Stancavage, F. (Oct. 26, 2015). Study of the alignment of the 2015 NAEP mathematics items at grades 4 and 8 to the Common Core State Standards (CCSS) for mathematics. Retrieved from http://www.air.org/resource/study-alignment-2015-naep-mathematics-items-grades-4-and-8-common-core-state-standards-ccss.
- Heitin, L. (October 28, 2015). Math NAEP scores drop for 4th and 8th grades. Education Week. Retrieved from http://blogs.edweek.org/edweek/curriculum/2015/10/math_naep_scores_drop_for_4th_8th_grades.html.

 St. Agnes School, St. Paul, MN